In this post i describe an option to visualize the statement statistics collected by pg_stat_statments in Grafana.
When using PostgreSQL you probably already know the fabulous pg_stat_statements extension. For those who don’t know it, it is an extension that keeps track of all queries executed inside your database. By doing so it provides you with very detailed information about the activities inside a database. For example, you will be provided with statistics which SQL Statements run, how many times and how long it took in total, min, max and even the standard deviation. As i have never experienced a noticeable overhead or other problems with this extension, i think it’s way better than just to keep track of slow queries activated with ‚log_statements = [duration]‘. I definitely recommend the extension and personal i use it in all of my PostgreSQL projects.
The installation is briefly described here:
https://www.postgresql.org/docs/current/static/pgstatstatements.html
Basically it needs three steps, first of all install the extension
CREATE EXTENSION pg_stat_statements;
Now you need to add the extension to the preloaded libraries in your postgresql.conf
shared_preload_libraries = 'pg_stat_statements'
Afterwards a restart of your PostgreSQL Instance is required. To confirm that pg_stat_statements is working, just query the statistics like this.
\x
SELECT * FROM pg_stat_statements LIMIT 1;
-[ RECORD 1 ]-------+------------------------
userid | 10
dbid | 16724
queryid | 1581835610
query | vacuum pgbench_accounts
calls | 1
total_time | 189.943562
min_time | 189.943562
max_time | 189.943562
mean_time | 189.943562
stddev_time | 0
rows | 0
shared_blks_hit | 5419
shared_blks_read | 0
shared_blks_dirtied | 1974
shared_blks_written | 0
local_blks_hit | 0
local_blks_read | 0
local_blks_dirtied | 0
local_blks_written | 0
temp_blks_read | 0
temp_blks_written | 0
blk_read_time | 0
blk_write_time | 0
You will find a detailed explanation of all the columns in the PostgreSQL docs. We now write a query that provides us the information about the number of calls, total_time, mean_time, stddev_time and the number of rows.
					SELECT SUBSTRING(query,0,80) AS query,
       calls,
       ROUND(calls * 100 / SUM(calls) OVER (),2) AS pct_total_calls,
       total_time,
       ROUND(total_time::NUMERIC * 100 / SUM(total_time::NUMERIC) OVER (),2) AS pct_total_time,
       mean_time,
       stddev_time,
       rows
FROM pg_stat_statements
ORDER BY calls DESC;
I cutted the first column to 80 characters for better readability on the screen. Later, when we integrate the query in Grafana you can display the whole query or increase the number of characters as Grafana will wrap long lines automatic. The two calculated columns are there to give you an expression about the percentage distribution of your queries.
Let’s come to Grafana. Grafana is a Tool to visualize System Metrics stored in a large variety of data sources, mainly TimeSeries Databases like Graphite or InfluxDB. But in the latest version 4.6 also a PostgreSQL data source was added to Grafana. See: http://docs.grafana.org/features/datasources/postgres for all the details. Using this data source allows you to either display system metrics as a graph or as a table. For our purpose we will configure a table panel. But let’s configure the PostgreSQL datasource in Grafana first. To do so, click on the Grafana icon in the upper left corner of the UI and go to ‚Data Sources‘. Next got to ‚+ Add data source‘, select PostgreSQL and fill out the connection details, for example:
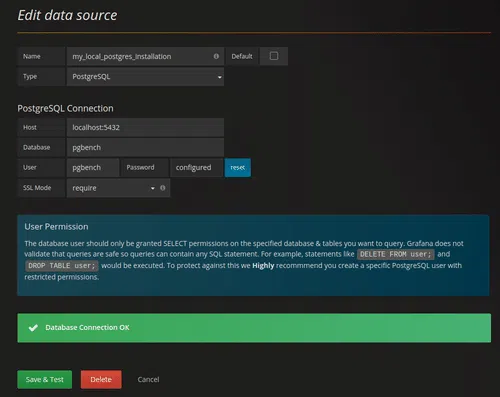
Pay attention to the hint about user permissions on the dialogue. Basically it says that you should not use a user with more permissions than necessary to query for statistics. This leads us to a problem, a normal user in Postgres can only view his own queries and is therefore not able to view the queries of other users.
So using pg_stat_statements with an unprivileged user will show up ‚<insufficient privilege>‘ instead of the query. Despite this limitation you are not forced to use an account with superuser privileges in Grafana (don’t do it). Instead just create a function with the setting ’security definer‘ as superuser and give the user execute permissions, like this:
					CREATE FUNCTION my_stat_statements() RETURNS SETOF pg_stat_statements
AS $$
  SELECT * FROM pg_stat_statements;
$$
  LANGUAGE SQL SECURITY DEFINER;

GRANT EXECUTE ON FUNCTION my_stat_statements() TO pgbench;
The import part is: ‚SECURITY DEFINER‘. When executing this function, it is executed with the permissions of the users that created the function not the one that execute it. This allows otherwise unprivileged users to view the required informations.
Let‘ come back to Grafana:
Now that the data source is in place we can create a new dashboard. In the first row add a table panel. Clicking on the Panel title opens the edit menu. Make sure you select the previously created datasource here, and copy the above statement into the box where ‚SELECT 1‘ is shown by default. You only need to replace ‚FROM pg_stat_statements‘ with ‚FROM my_stat_statements()‘ to make things work.
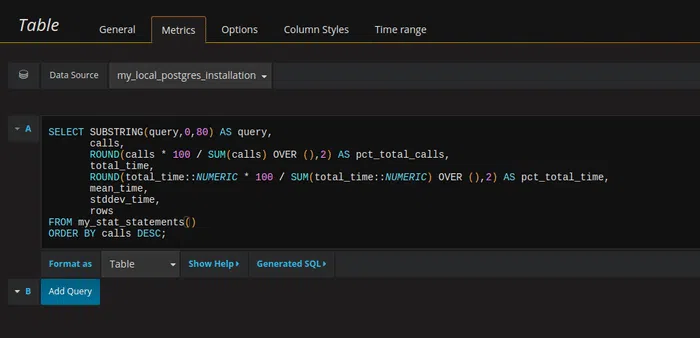
Afterwards you have a table panel showing the result of our query in Grafana. The magic Grafana provides here is the ability to sort by any column you want, either ascending or descending by just clicking on the column header.
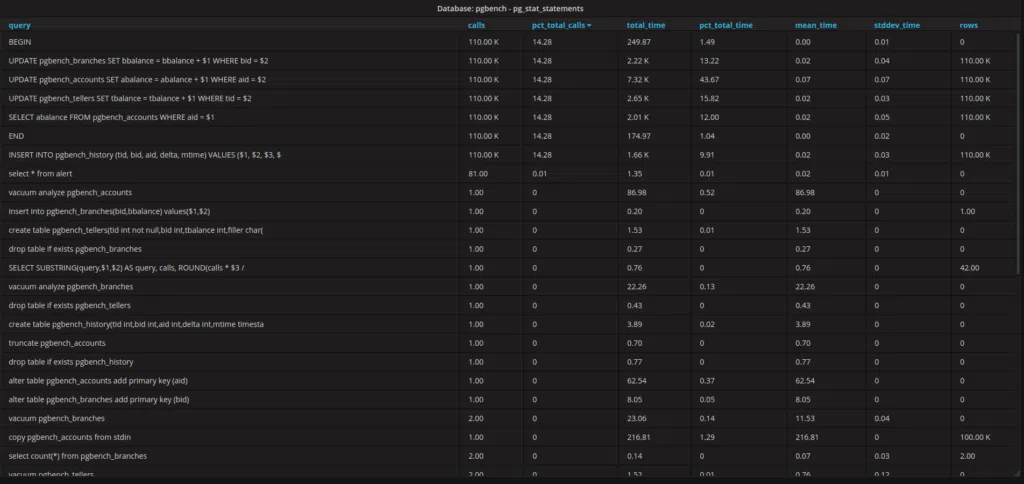
As you can see in the example it is a database used for pgbench testing.
Following this quick walk through you will end up with a very flexible view about what’s going on in your database and an option to identify ‚bad‘ queries.
If you ever wanted to reset the statistics you can do so by issuing:
SELECT pg_stat_statements_reset();
Have fun!